The role of analytics in ecommerce: 2026 guide

TL;DR:
Many ecommerce owners struggle with fragmented data sources that hinder accurate insights and decision-making. Implementing a semantic layer to encode business logic and focusing on core KPIs enables smarter, scalable analytics. Building a solid foundation through data integration and regular review is essential before adopting predictive models and AI tools for growth.
Most ecommerce store owners are drowning in data but starving for insight. Sound familiar? The role of analytics in ecommerce is not just about pulling reports and nodding at numbers. It’s about turning raw information into decisions that actually move the needle on sales, margins, and customer loyalty. And yet, a shocking number of online retailers treat their analytics dashboard the way most people treat the terms and conditions popup: they click past it without reading a thing. Let’s fix that, shall we?
Table of Contents
Key takeaways
Point | Details |
Analytics goes beyond metrics | Understanding KPIs, diagnostic trends, and predictive signals is what separates profitable stores from guessing ones. |
Integration is the real advantage | Connecting your data sources matters more than having sophisticated algorithms you barely understand. |
Predictive analytics lifts margins | AI-powered pricing and demand forecasting can produce gross-profit lifts up to 80% versus rule-based approaches. |
Semantic layers prevent costly errors | Feeding raw data into AI tools without defined business logic produces inaccurate, misleading insights. |
Start simple, then scale | Track a handful of core KPIs first, build your workflow, then layer in predictive models as your confidence grows. |
The role of analytics in ecommerce, explained
Before you can use analytics effectively, you need to know what you’re actually talking about. And honestly, most people conflate three different things: metrics, KPIs, and analytics. They’re related, but they’re not the same thing.
A metric is just a number. Page views, sessions, add-to-cart counts. A KPI (key performance indicator) is a metric tied to a business goal. Conversion rate is a KPI. Revenue per visitor is a KPI. Analytics is the process of collecting, organising, and interpreting all of it to make smarter decisions.
There are four types of analytics worth knowing:
Descriptive analytics: Tells you what happened. “Sales dropped 15% last Tuesday.” Good for reporting.
Diagnostic analytics: Tells you why it happened. “Sales dropped because your shipping costs increased and customers bounced at checkout.” Better for problem-solving.
Predictive analytics: Tells you what’s likely to happen. “Based on last year’s patterns, you’ll see a 30% spike in demand in week three of November.” This is where it gets interesting.
Prescriptive analytics: Tells you what to do about it. “Increase your ad spend on SKU #4421 and reduce inventory on SKU #1108 before Black Friday.” This is the gold standard.
The importance of data analytics in ecommerce also spans the entire customer lifecycle. Key metrics span from discovery to advocacy, covering customer acquisition cost, conversion rate, average order value, and repeat purchase rates. Each stage of that journey tells a different story, and ignoring any stage is like watching only the second act of a movie and wondering why you’re confused.
How analytics actually drives better decisions
Here’s where things get practical. The uses of data in online stores touch nearly every corner of your business. Let’s break down the four biggest impact zones.

Marketing ROI. When you know which campaigns are driving actual revenue (not just clicks), you stop wasting budget on channels that flatter your vanity metrics. Analytics-driven marketing budget allocation routinely outperforms gut-feel spending. Studies show that analytics in marketing drives 57% better ROI compared to non-data-driven approaches. That’s not a rounding error. That’s a massive competitive edge.
Dynamic pricing. This one surprises people. Advanced pricing models powered by predictive analytics don’t just react to competitor prices. They factor in demand signals, inventory levels, and customer segments simultaneously. And the payoff is real.
Inventory optimisation. Running out of your bestseller during peak season is basically giving your competitors a gift basket. Analytics helps you forecast demand, reduce overstock, and cut the carrying costs that quietly eat your margins.
Customer retention. It costs five times more to acquire a new customer than to keep an existing one. Analytics identifies at-risk customers before they churn, enabling personalised outreach that actually lands.
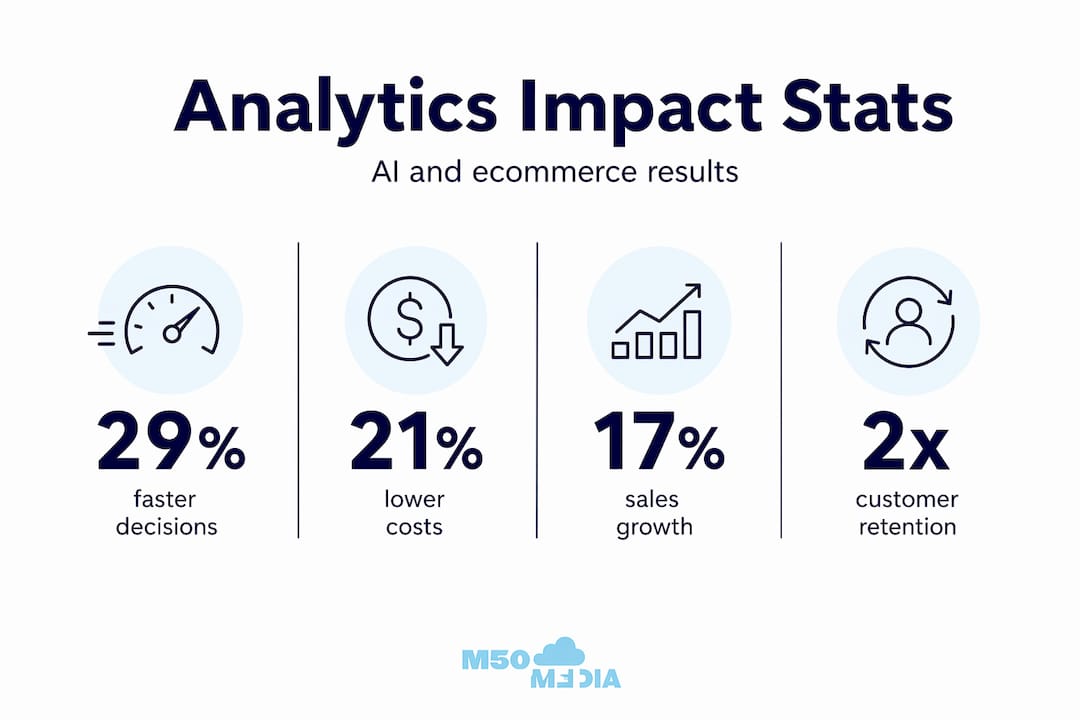
Companies using real-time analytics report a 29% improvement in decision speed and a 21% reduction in operational costs. Think about what that means for a store running on thin margins. Speed and efficiency are not luxuries. They’re survival tools.
Pro Tip: Don’t just track average order value as a single number. Segment it by traffic source, device type, and customer cohort. You’ll almost always find one segment pulling the average down, and fixing that one segment can move your overall revenue faster than any new ad campaign.
The messy truth about ecommerce data challenges
Nobody warns you about this part. Implementing analytics sounds clean and logical in theory. In practice? It can feel like trying to assemble IKEA furniture with instructions written in ancient Sumerian.
The biggest culprit is fragmented data sources. Your Shopify store, your email platform, your Google Ads account, your inventory system, and your CRM are all speaking different dialects. Without integration, you end up with four separate “truths” that contradict each other in your Monday morning report.
This is where CRM integration in ecommerce becomes critical. Siloed data is not just annoying. It actively produces wrong answers. And when you start layering AI tools on top of fragmented data? Things get worse fast.
Here’s a pitfall that doesn’t get discussed enough: LLMs querying raw ecommerce data frequently produce inaccurate results because the missing business logic causes AI hallucinations. What does that mean in plain terms? Your AI-generated insight says revenue is up 12%, but it forgot to account for returns, subscription bundle discounts, and marketplace fees. You make a decision based on a fiction. Ecommerce data is genuinely complex due to returns, bundles, and varied fees, requiring specialised data handling that generic AI tools are not built for.
The solution is a semantic layer: a defined set of certified metric definitions that encode your business logic before any AI or reporting tool touches the data. Semantic layers lock in business logic and deliver auditable, consistent analytics. It’s not glamorous to talk about, but it’s the foundation everything else rests on.
Pro Tip: When evaluating analytics tools for ecommerce, ask one question before signing up: “Can I define and lock in my own metric logic?” If the answer is vague or they pivot to showing you pretty dashboards, keep looking.
Predictive analytics and AI in ecommerce
Now for the exciting stuff. Predictive analytics is where the impact of analytics on retail really shows its teeth. And if you think this is only for enterprise players with massive data science teams, think again.
Here is a quick look at what predictive and AI-powered analytics actually does in practice versus traditional approaches:
Capability | Traditional approach | Predictive/AI approach |
Demand forecasting | Historical averages, gut feel | Seasonality models, trend signals, real-time feeds |
Pricing | Fixed rules, manual competitor checks | Dynamic models adjusting by demand, margin, and segment |
Personalisation | Broad segments, generic emails | Individual behaviour patterns, next-best-offer models |
Churn prevention | React after the customer leaves | Identify at-risk customers 30 to 60 days in advance |
Inventory planning | Reorder points set manually | Automated reorder triggers based on sell-through forecasts |
AI-powered systems support real-time decisions and personalised experiences at a scale that manual processes simply can’t match. Recommendation engines, for example, don’t just suggest “you might also like this.” They weigh purchase history, browsing behaviour, inventory levels, and margin targets simultaneously.
How analytics improve online sales through AI is increasingly well-documented. Retailers using advanced analytics achieve 93% higher profits compared to those using traditional methods. That is a staggering gap, and it compounds over time.
For those building towards a more advanced setup, the goal is a decision intelligence stack. This combines forecasting models, pricing optimisation tools, experimentation frameworks, and a human review layer. SMBs struggle mostly with integration rather than algorithmic novelty, which means the bottleneck is almost never “we don’t have smart enough AI.” It’s “our data is a mess and our tools don’t talk to each other.” Worth checking out AI in ecommerce examples to see what well-integrated setups actually look like in 2026.
How to actually implement ecommerce analytics
Right. You’re sold on the value. Now what? Here’s a grounded, practical path forward:
Define your core KPIs first. Pick five to eight metrics that directly connect to revenue and customer health. Conversion rate, average order value, customer acquisition cost, repeat purchase rate, and cart abandonment rate are a solid starting set. Don’t chase 40 metrics before you’ve mastered five.
Audit your data sources. List every platform that generates customer or transaction data. Identify where they overlap, where they conflict, and where there are gaps. This is the boring work that makes everything else possible.
Choose analytics tools for ecommerce that integrate with your stack. Ecommerce platforms with open APIs help unify data and eliminate silos. Prioritise tools that connect natively to your store, email platform, and ad accounts.
Build a decision-support workflow. Data should inform decisions, not replace the human making them. Set up a weekly rhythm: review your KPIs, flag anomalies, hypothesise causes, and test one change at a time. This is the loop that builds real analytical muscle over time.
Layer in predictive models as you scale. Once your data is clean and your core KPIs are stable, start exploring demand forecasting and churn prediction. Don’t skip steps two and three trying to get here faster. It never works the way you hope.
Pro Tip: Start with a free or low-cost analytics tool connected to your store and run it for 60 days before evaluating paid upgrades. You’ll learn what data you actually need, which prevents you from paying for features you’ll never use. Explore ecommerce marketing channels to understand which traffic sources deserve the deepest analytics attention first.
My take on where most ecommerce owners go wrong
I’ve worked with a lot of ecommerce business owners who come to me frustrated that their analytics setup isn’t delivering results. And almost every single time, the problem is not the algorithm. It’s the foundation.
People get dazzled by AI dashboards and predictive models, then wonder why the outputs make no sense. They skipped the step where you actually define what “revenue” means in your specific business context. Does it include returns? Which fees are deducted? How do you handle subscription renewals? If your data doesn’t reflect those answers, no algorithm on the planet will save you.
What I’ve learned from years in digital marketing is this: the competitive advantage for smaller merchants lies in integrating data and decision workflows, not just adding fancier models. The store that wins is the one where the right person sees the right insight at the right time and acts on it. That requires systems, not just software.
My honest advice? Invest in clarity before you invest in sophistication. Get your data sources talking to each other. Define your metrics with specificity. Build the habit of weekly data review. Then, and only then, start exploring predictive tools. The returns compound fast once the foundation is solid.
— Karl
Ready to make your analytics work harder?
So now you know the theory and the pitfalls. But knowing and doing are two very different things, right? That’s where M50media comes in.

Karl works directly with ecommerce business owners and marketing professionals to turn analytics confusion into clear, profitable decisions. Whether you need help auditing your current setup, building a KPI framework, or figuring out which tools actually make sense for your store, the M50media digital coaching programme is designed exactly for this. Not sure where to start? Book a free marketing SOS call and get personalised guidance in one focused session. No fluff, no sales pitch. Just straight answers.
FAQ
What is the role of analytics in ecommerce?
Analytics in ecommerce is the process of collecting and interpreting data across the customer lifecycle to drive smarter decisions on marketing, pricing, inventory, and retention. It covers everything from basic reporting to predictive modelling.
How does analytics improve online sales?
Analytics identifies which channels, products, and customer segments drive the most revenue, allowing you to allocate budget and effort where returns are highest. Retailers using advanced analytics achieve 93% higher profits compared to traditional methods.
What analytics tools work best for ecommerce?
The best analytics tools for ecommerce integrate directly with your store platform, ad accounts, and email system to unify customer and transaction data. Prioritise tools with open APIs and the ability to define certified metric logic for your specific business.
Why is a semantic layer important in ecommerce analytics?
A semantic layer encodes your business logic (returns, fees, subscription rules) before any reporting or AI tool processes the data. Without it, AI tools querying raw data will produce inaccurate and potentially costly insights.
How do I get started with ecommerce analytics?
Start by defining five to eight core KPIs tied directly to revenue, then audit your data sources for gaps and conflicts. Build a consistent weekly review habit before adding predictive tools or AI-powered features.
Recommended
Comments